 By the NAXTECH team · Published 5 Sept 2026 · Updated 9 Oct 2026 · Hands-on with v1.0

The vehicle will not arm, the ground station laptop is back in the car, and all you have at the flight line is your phone. Somewhere in the MAVLink stream is the pre-arm check that is blocking you — but a generic serial terminal just shows you raw bytes. MAVLink Inspector was built for exactly that moment: a real telemetry analyzer that lives in your pocket.
Connect over UDP, TCP, USB serial or Bluetooth and the app decodes every MAVLink v1 and v2 message as it arrives, showing live rates, packet loss and CRC errors for each system and component. It reads the official ArduPilot and common dialects out of the box, and you can import your own XML when your autopilot speaks a custom one.
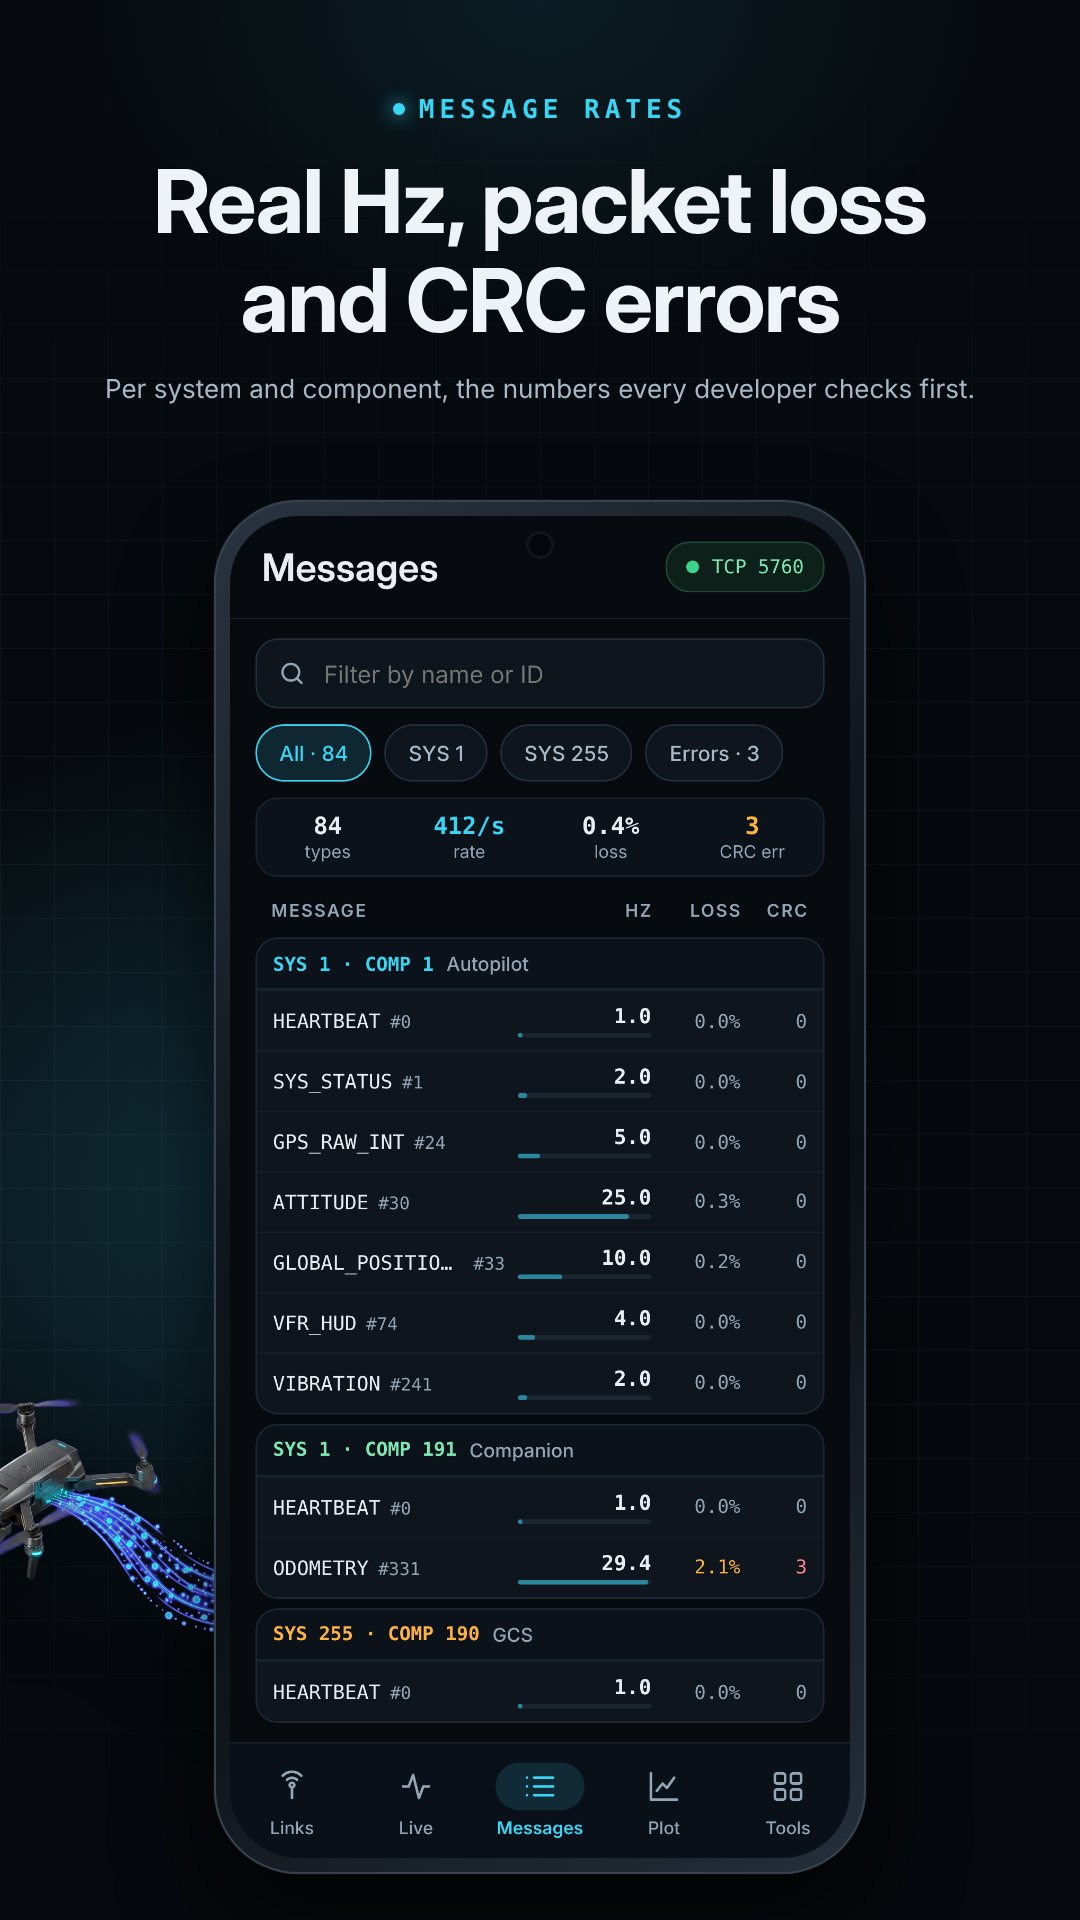
The Messages screen lists each message type with its live Hz rate, loss and CRC error count, filterable by name or ID or down to a single system. Tap a message and the hex inspector breaks the frame apart byte by byte: header, payload and checksum, the message version, whether it is signed or unsigned, and the CRC_EXTRA used to validate it. Tap any byte and the app tells you which field it belongs to — and offers to plot it.
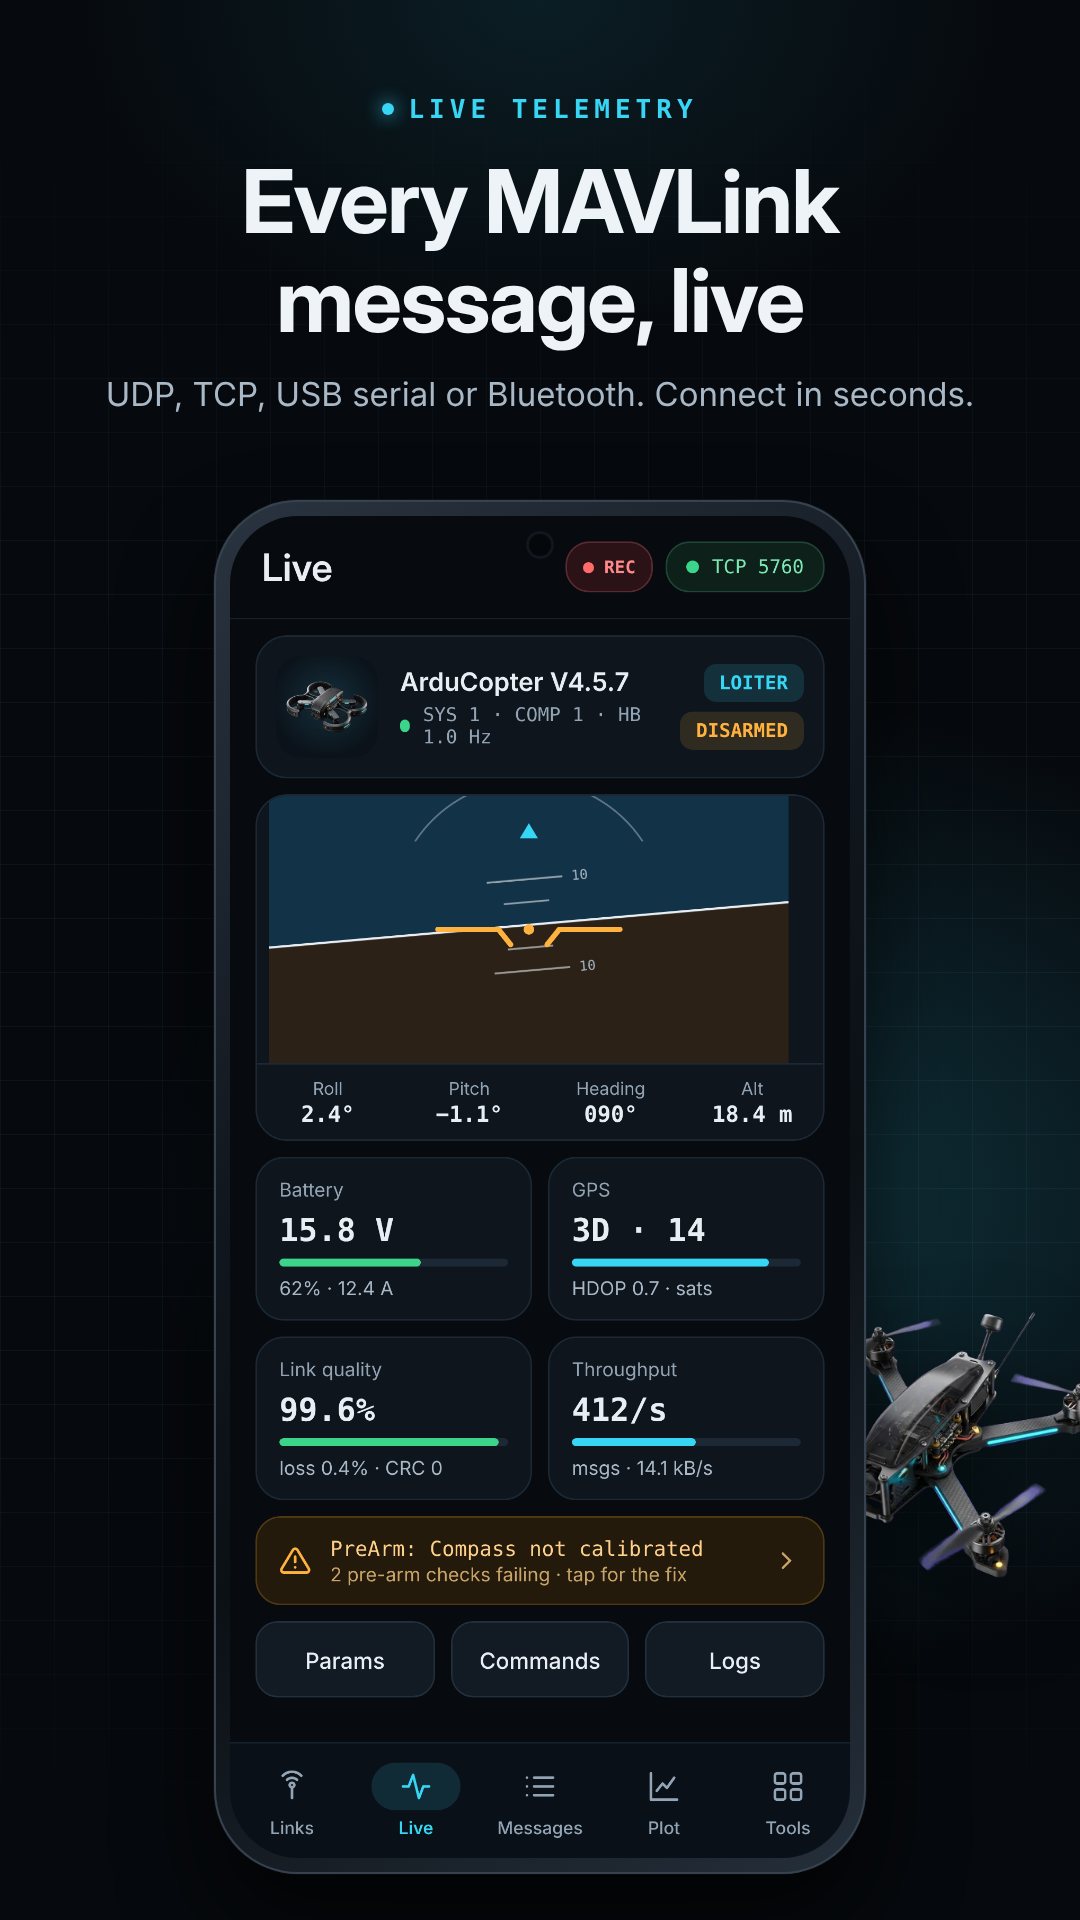
The Live screen reads the autopilot HEARTBEAT and lays out roll, pitch and heading, altitude, battery voltage, current and percentage, GPS fix, satellite count and HDOP, plus link quality and throughput — per vehicle, with multiple systems and components on one link. When a pre-arm check fails, the STATUSTEXT screen does not just show the raw message: it explains what checks like compass calibration, GPS fix, RC calibration, fence or battery-low actually mean, and how to fix them.
Add a field such as ATTITUDE.roll to the real-time plot and watch it over a rolling 10, 30 or 60 second window; Pro overlays up to six fields at once, so you can line up vibration or variance channels side by side. Record the whole session to a .tlog file that Mission Planner and QGroundControl can open, then replay it later with a speed control and a HOME-relative distance, altitude and speed read-out.
Plug a SiK radio into your phone over USB OTG and the router fans that one telemetry link out over Wi-Fi to every laptop running a ground station — point each output at a host and UDP port and you are bridging in seconds. An MQTT forward pipes the same stream to your broker, and a built-in simulator generates a fake vehicle on a local UDP port so you can test a dashboard or a pipeline with no hardware at all.
.param file..param file to spot what changed.There are no interstitial or pop-up ads, ever — a single banner shows only on the Links, Flight logs and Dialects screens, and disappears entirely while a link is live. Arm, takeoff, motor test and reboot always go through a confirmation checklist with a three-second hold, so a fat-fingered tap never spins a propeller. The screen stays awake while a link is active, and the one-time Pro unlock turns on USB and Bluetooth, custom dialects, record and replay, multi-field plotting, the router, MQTT and the simulator.
MAVLink Inspector is a telemetry viewer and developer tool: parameters are read-only by design, so it inspects, exports and diffs but never writes a value back to the vehicle. MAVLink 2 signing is detected and shown but not verified. Treat the arming and motor-test commands with the same care you would at a full ground station — they command real hardware.
UDP, TCP, USB serial (SiK, FTDI and CP210x radios over OTG) and Bluetooth SPP modules such as the HC-05, including a Quick listen mode and SITL over TCP.
Yes. It records and replays standard .tlog files, so logs are interchangeable with Mission Planner and QGroundControl.
Yes. The official dialects are built in, and you can import your own MAVLink XML to decode custom messages.
Yes, it is free with a single banner ad and no pop-ups; an optional one-time Pro purchase unlocks USB, Bluetooth, recording, multi-field plots, the router, MQTT and the simulator.